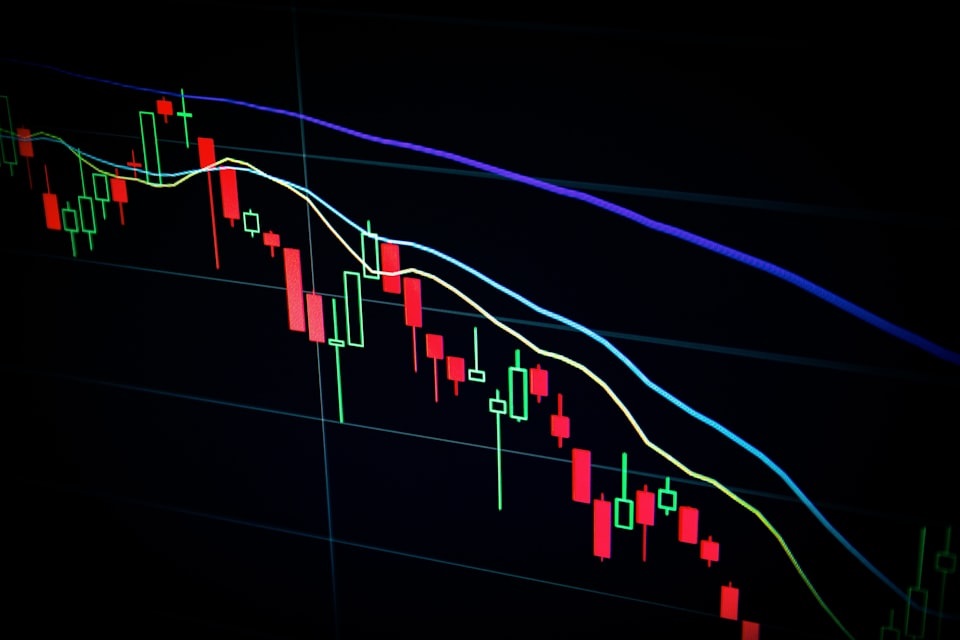
Artificial intelligence (AI) is transforming trading. More traders are turning to AI to develop and test trading strategies. Backtesting is a vital part of this process. It allows you to performed using historical market data.
Identify a strategy to test
The first step is identifying a trading strategy you want to test using AI. There are endless possibilities, but a few common ones include:
- Moving average crossover strategy
- Mean reversion strategy
- Momentum strategy
- Sentiment analysis strategy
For this example, let’s say we want to test a simple moving average crossover strategy. This involves buying when a short-term moving average exceeds a long-term moving average and selling when the opposite occurs.
Obtain historical market data
Next, you’ll need historical price data for the market(s) you want to test your strategy. There are many sources for this data, both free and paid. A few options:
- Yahoo Finance (free)
- Google Finance (free)
- Quandl (freemium)
- Bloomberg (paid)
Aim to get at least a few years of daily price data, including open, high, low, and close prices and volume. Make sure the data is clean and consistent Benefits of Quantum AI save it in an accessible format like CSV.
Prepare the data
With the raw price data in hand, you need to prepare it for analysis.
- Import the data into your programming environment (e.g. Python, R)
- Convert the data into a suitable format, like a Pandas data frame
- Perform any necessary data transformations or feature engineering
In our moving average example, we’ll need to calculate the short-term and long-term moving averages for each day. Let’s use 50-day and 200-day moving averages.
Define entry and exit rules
Now, define the specific rules for entering and exiting trades based on your strategy.
For our example:
- Enter long trade when 50-day MA crosses above 200-day MA
- Exit long trade and enter short trade when 50-day MA crosses below 200-day MA
- Exit all trades at the end of the testing period
Consider additional rules like position sizing, risk management, etc. But let’s keep it simple for now.
Code the backtest
The next step is actually to code the backtest in your programming environment. This will vary depending on the language and libraries you use. But the general steps are:
- Loop through each row (trading day) in the data frame
- Check if the entry/exit rules are triggered
- If an entry is triggered, record trade in a “trades” data frame (entry date, entry price, position size, etc.)
- If an exit is triggered, record the exit in the trades data frame
- Move to the next row and repeat
There are Python libraries like Zipline and Backtrader that help automate much of this. But it’s good to understand the process before using those.
Analyze the results
After running the backtest, you’ll have a data frame with all the trades. Now, it’s time to analyze the results and see how the strategy performed.
- Total return (%)
- Annualized return (%)
- Sharpe ratio
- Max drawdown
- Win rate
- Avg win/loss
- Profit factor
Look at these metrics holistically. A high return isn’t significant without large drawdowns and losses. Ideally, we want steady returns with manageable risk. Before trading the strategy with real money, forward and test it. This means testing it on new out-of-sample data with paper trading or tiny positions. Monitor it closely and see if it performs in line with expectations from the backtest.
Only after the strategy performs well in forward testing would you consider scaling it up with real money. And even then, start small and manage risk carefully.


